Do you have an interest in a new, comprehensive dataset of cycling infrastructure in the city? If so, we need your help!
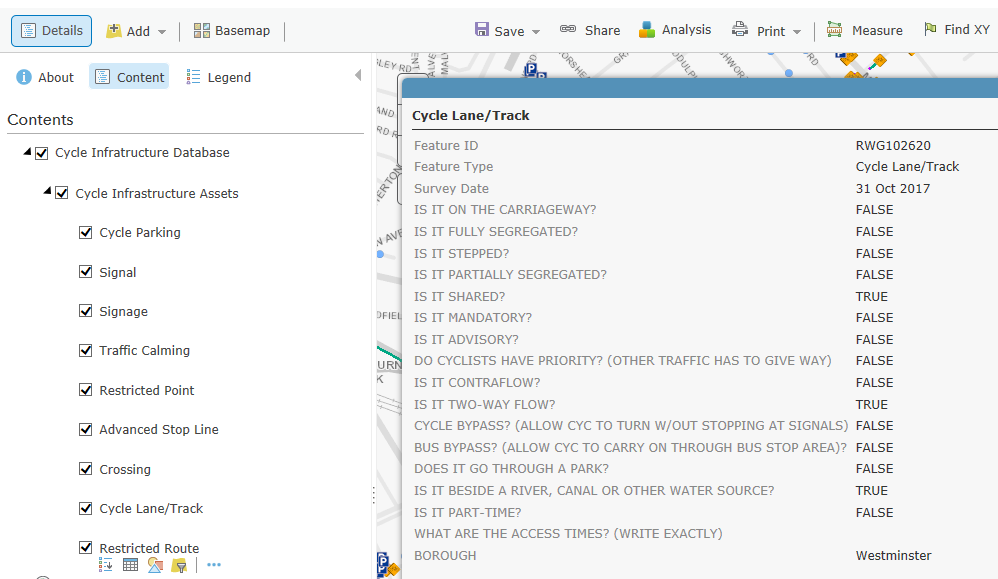
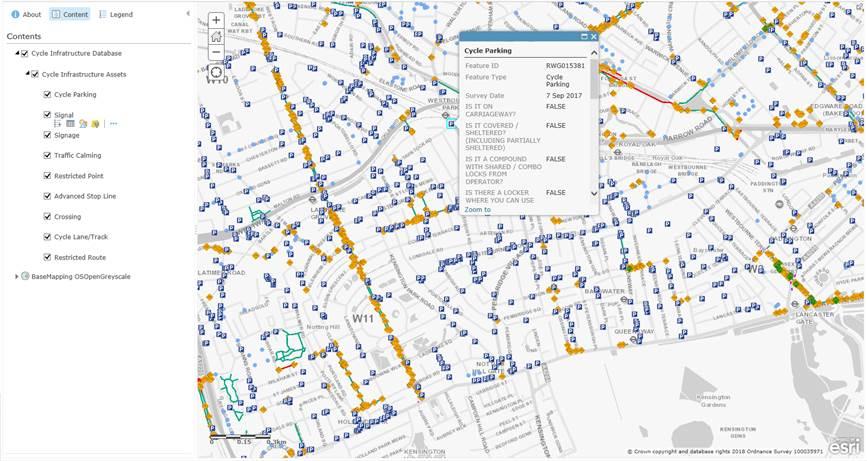
We are currently developing a Cycling Infrastructure Database. This is a ground breaking database that contains every single cycle infrastructure asset within Greater London, including assets on and off-carriageway. The assets we have surveyed are - cycle parking, signals, signage, traffic calming measures, restricted points (eg steps), advanced stop lines, crossings, cycle lanes/tracks and restricted routes (eg pedestrian only routes).
The CID is a Mayoral priority project led by Will Norman, the Cycling and Walking Commissioner, working with TfL’s City Planning Active Travel team, Data and Spatial Analysis and Technology and Data teams.
The database will not only provide us with accurate information on cycling infrastructure in the city to aid our maintenance and planning teams but will also provide a data feed which we plan to publish as open data later this year.
How did we collect the data? To do this, we divided Greater London into 25 data packages for surveying purposes and the data collection was completed in May 2018. The data is currently being validated and, in parallel to this, the network assignment stage, where assets are assigned to the ITN and Open Street Map road networks, is in progress.
The screenshots below show the visualisation of some of the asset types we have collected and we’ve also attached the schema for you to take a look at. We want to know which of the assets and which attributes we are collecting would be of most use to you in developing new and innovative products. This will help us to understand which elements should be exposed in the Unified API and inform our technical design. Please post your thoughts below. We look forward to hearing from you!
At the risk of appearing cynical (me? cynical?), how about “are any bicycles using the facility at the moment?”?
Any cynicism is brought on by the rarity of seeing a bike on the cycle paths between Enfield Town and the North Circular. Encouraging cycling is great in theory but if a facility simply slows down buses (as this one has) it’s not really doing anyone much good.
Hi @mjcarchive
Thanks for your feedback but just wanted to reiterate this forum is for technical/data discussions. If you want to comment on cycling schemes, we post all our consultations here. Each borough also has a consultation scheme. Here’s the link for Enfield’s cycling consultations.
Having said that, one of the main reasons we want to publish this data is that we hope that by using it in cycle routing products or maps, it will help cyclists know where the infrastructure is and how it all fits together. Hopefully that will help increase usage.
We do track usage of the cycle lanes and are working to get the cycle counter data fixed. This comes from the counters which we’re trialling on a couple of the Superhighways at the moment.
I realise that it is a bit distant from the usual topic of data for app building but one of the points of FOI and Open Data is that the outside world can assess for itself how the success of different schemes compares, which then leads on to the factors that make them differ. So yes, let’s get usage data for all schemes, and not just the superhighways, which get you right into central London.
Thanks so much for your feedback! So you’d prefer the data to be available as GML and GeoJSON downloads rather than integrated into the API. That’s good to know and we’ll take that on board in the technical design. Are you able to share what use cases you’d be considering?
We are planning to release updated cycling route data in the next few months and this will include forthcoming routes as well as those which have been opened. Watch this space!
@theochapple this is very exciting, although I agree with Alex that an API may be unnecessary, how often will this dataset be updated? Certainly my initial thought is that a geocoded dataset may be more useful. Are you able to share what this could look like so that we can provide feedback? Excellent work btw.
Thanks @altoid. Our thinking was that for use cases where a developer wanted to query for specific types of infrastructure eg bike parking or specific types of infrastructure with specific attributes or for specific types of infrastructure within a set geographical boundary, for example, the API has those queries already built in to the /place endpoint so could be quite useful.
In terms of maintenance, the strategy for that is currently being looked at. It is a dependency for the launch to have that in place. We anticipate that we’ll refresh the data every 24 hours at least.
For the field “Cycle Lane/Track ID”, was the value created for the CID? How much does it currently get referred to by people or systems? What format would a value be in, could you give an example?
Hi @Gregory
Each asset that is collected in the CID has a unique Feature ID, and that Feature ID is also used for the asset photos. We use the ID to identify an asset and its associated photos. We are unable to publish the photos due to privacy restrictions are so will remove the asset photo ID field. The typical format for the ID is RWG000000.
A demonstrator map, for the purposes (only) of evaluation by the OpenStreetMap community at this stage, has been created by CycleStreets. Note that the demonstrator map contains only one of the 25 areas that have been surveyed.
Usage notes: The controls on the right of the map allow the different feature types to be selected. The OSM layer (available at zoom level 19+) also provides a live feed from the OSM API, to enable quick comparisons. The two photos of each asset are in the process of being supplied; those already available and cleared in GDPR terms are included in the popup.
It is stressed that, at this time, no permission is given for re-use of the data in any way, but we understand that TfL strongly intends to make this available in future. All 25 areas would be covered in the final data release, not merely the one shown currently in the demonstrator map.