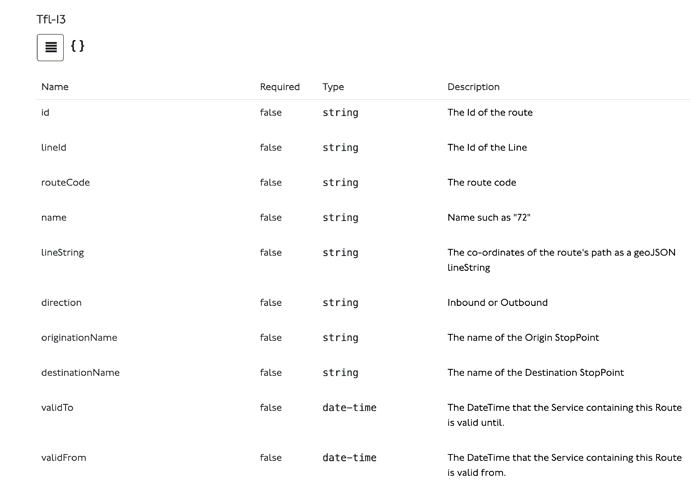
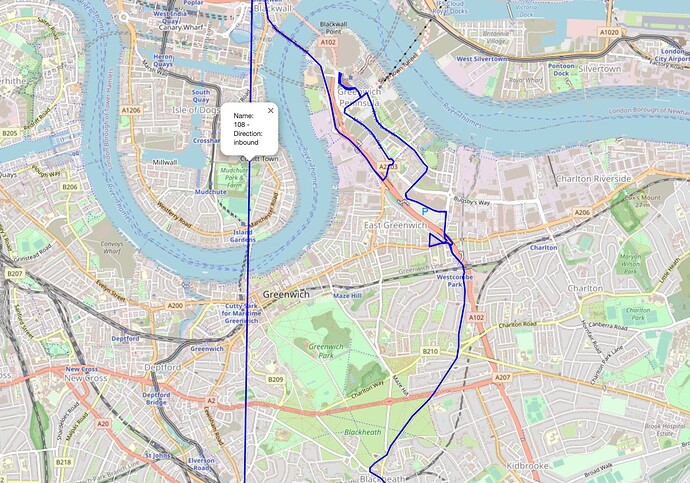
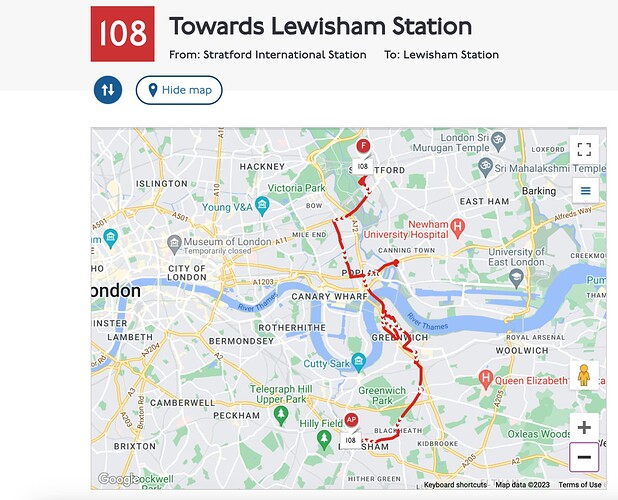
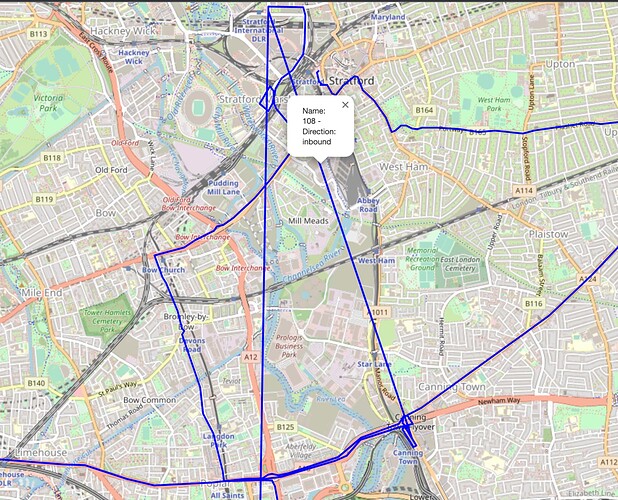
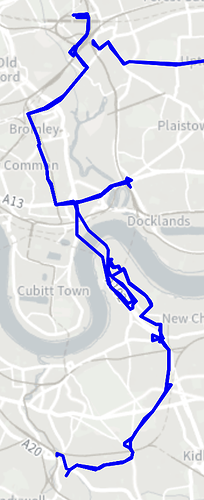
I think I found the issue…
In the first chunk these two coordinates come after each other - [51.46487, -0.013161], [51.545518, -0.007304].
This then creates a direct line between the Lewisham Station and the Stratford International Station.
Causing me a bit of a headache this!
I was debugging and trying to troubleshoot with the code below (notebooke) - any help would be grand!
@nickp /@briantist
import folium

# Coordinates for 108 bus service
coordinates = [[51.545518, -0.007304], [51.545499, -0.003888], [51.543719, -0.003908], [51.543157, -0.003954], [51.543157, -0.003954], [51.542866, -0.004018], [51.54258, -0.004131], [51.542367, -0.004299], [51.541881, -0.00481], [51.541442, -0.005406], [51.541241, -0.005747], [51.54111, -0.005983], [51.540834, -0.006673], [51.540427, -0.007052], [51.540081, -0.007355], [51.539716, -0.007573], [51.539035, -0.007704], [51.538768, -0.007859], [51.538415, -0.00825], [51.53899, -0.009278], [51.539609, -0.008647], [51.539609, -0.008647], [51.540228, -0.008026], [51.540144, -0.0079], [51.539943, -0.007664], [51.539671, -0.007546], [51.539302, -0.007519], [51.538943, -0.007592], [51.538815, -0.007454], [51.538688, -0.007401], [51.538569, -0.007291], [51.537147, -0.005408], [51.537147, -0.005408], [51.536693, -0.004807], [51.536277, -0.004147], [51.535891, -0.004671], [51.535891, -0.004671], [51.533828, -0.007266], [51.533828, -0.007266], [51.531456, -0.010442], [51.530979, -0.010997], [51.530369, -0.012086], [51.530369, -0.012086], [51.529798, -0.013427], [51.529684, -0.013605], [51.529611, -0.013579], [51.529505, -0.013685], [51.52948, -0.014335], [51.528869, -0.015947], [51.528449, -0.017428], [51.528449, -0.017428], [51.528343, -0.017815], [51.528016, -0.020496], [51.528016, -0.020496], [51.527833, -0.021673], [51.526234, -0.020733], [51.525759, -0.020306], [51.525396, -0.020068], [51.525396, -0.020068], [51.524686, -0.019589], [51.523696, -0.018998], [51.523324, -0.018798], [51.522797, -0.018591], [51.522797, -0.018591], [51.522374, -0.018435], [51.522253, -0.01821], [51.522014, -0.018479], [51.521315, -0.018067], [51.521315, -0.018067], [51.51852, -0.01657], [51.518093, -0.0163], [51.517839, -0.01621], [51.516902, -0.016031], [51.516902, -0.016031], [51.516297, -0.015917], [51.516242, -0.015862], [51.515971, -0.015801], [51.515744, -0.015638], [51.515186, -0.015072], [51.514848, -0.014853], [51.514848, -0.014853], [51.514562, -0.014702], [51.511783, -0.013624], [51.511783, -0.013624], [51.511508, -0.013531], [51.511426, -0.013444], [51.51119, -0.013343], [51.511281, -0.011496], [51.511281, -0.011496], [51.511341, -0.011103], [51.511348, -0.010425], [51.511439, -0.008922], [51.511688, -0.008205], [51.511726, -0.0078], [51.511109, -0.00733], [51.511109, -0.00733], [51.510889, -0.007217], [51.510238, -0.007], [51.50956, -0.006828], [51.509098, -0.006589], [51.508878, -0.006397], [51.506433, -0.00378], [51.506018, -0.003164], [51.503964, 0.000737], [51.503567, 0.001311], [51.503019, 0.00182], [51.502719, 0.00198], [51.502268, 0.002104], [51.501836, 0.002085], [51.49911, 0.001663], [51.498741, 0.001676], [51.498281, 0.001756], [51.496809, 0.002169], [51.49636, 0.002397], [51.495993, 0.00283], [51.495121, 0.004614], [51.494595, 0.005369], [51.494176, 0.006186], [51.493899, 0.006635], [51.493218, 0.007556], [51.493021, 0.008052], [51.492914, 0.008479], [51.493112, 0.008992], [51.493316, 0.009145], [51.493677, 0.009089], [51.494086, 0.008862], [51.494908, 0.008091], [51.495479, 0.00747], [51.495479, 0.00747], [51.495835, 0.006994], [51.496605, 0.005616], [51.496915, 0.004866], [51.49719, 0.004014], [51.497488, 0.003407], [51.497747, 0.003015], [51.498122, 0.002643], [51.498666, 0.002349], [51.499109, 0.00221], [51.499632, 0.002176], [51.500717, 0.002324], [51.500979, 0.002264], [51.501053, 0.002137], [51.501125, 0.002155], [51.501158, 0.002315], [51.501056, 0.003002], [51.500957, 0.003055], [51.500663, 0.002869], [51.500439, 0.002845], [51.500041, 0.002957], [51.499876, 0.003166], [51.499745, 0.00342], [51.499649, 0.003804], [51.499648, 0.004376], [51.499648, 0.004376], [51.499721, 0.004874], [51.499665, 0.004987], [51.499176, 0.005596], [51.49894, 0.005793], [51.499322, 0.006614], [51.499103, 0.006821], [51.498556, 0.007229], [51.498021, 0.007508], [51.497242, 0.007834], [51.496978, 0.008009], [51.496804, 0.008218], [51.496162, 0.009429], [51.495515, 0.011014], [51.494694, 0.012721], [51.494417, 0.01317], [51.494013, 0.013679], [51.494013, 0.013679], [51.493305, 0.014533], [51.492913, 0.014847], [51.492751, 0.014839], [51.492556, 0.014687], [51.491831, 0.01358], [51.491831, 0.01358], [51.490707, 0.011883], [51.490591, 0.011834], [51.490373, 0.011911], [51.490263, 0.01205], [51.490028, 0.01299], [51.490028, 0.01299], [51.489129, 0.016244], [51.489129, 0.016244], [51.489107, 0.017574], [51.488085, 0.017385], [51.487159, 0.017359], [51.487058, 0.017527], [51.486443, 0.018249], [51.486371, 0.018231], [51.486327, 0.018157], [51.486312, 0.017998], [51.486454, 0.017587], [51.48639, 0.017108], [51.485849, 0.017214], [51.485908, 0.017951], [51.485908, 0.017951], [51.485266, 0.018658], [51.484566, 0.019664], [51.484411, 0.019772], [51.483959, 0.019882], [51.483548, 0.019777], [51.483082, 0.019816], [51.483082, 0.019816], [51.482384, 0.019956], [51.481234, 0.019934], [51.48106, 0.019891], [51.48106, 0.019891], [51.478648, 0.019172], [51.478145, 0.019121], [51.477875, 0.019167], [51.477894, 0.019585], [51.478105, 0.020415], [51.478055, 0.020687], [51.477893, 0.020708], [51.477743, 0.020373], [51.477743, 0.020373], [51.47731, 0.019559], [51.476814, 0.019149], [51.476579, 0.018818], [51.476579, 0.018818], [51.474539, 0.016704], [51.474539, 0.016704], [51.473591, 0.015723], [51.473045, 0.015008], [51.472861, 0.01466], [51.472861, 0.01466], [51.471988, 0.013219], [51.469977, 0.010856], [51.469977, 0.010856], [51.469133, 0.00981], [51.467524, 0.008718], [51.46652, 0.008529], [51.466193, 0.008702], [51.465917, 0.00905], [51.465469, 0.009158], [51.465469, 0.009158], [51.46483, 0.008988], [51.46456, 0.009019], [51.464461, 0.008496], [51.463887, 0.006974], [51.463723, 0.006186], [51.463723, 0.006186], [51.463153, 0.000925], [51.463153, 0.000925], [51.463022, 0.000112], [51.462648, -0.000638], [51.462463, -0.001395], [51.462476, -0.002172], [51.462714, -0.003601], [51.462714, -0.003601], [51.463165, -0.006216], [51.463108, -0.007096], [51.462868, -0.008143], [51.462868, -0.008143], [51.462687, -0.008742], [51.462556, -0.009006], [51.462389, -0.009215], [51.462488, -0.009758], [51.462649, -0.010255], [51.462739, -0.010309], [51.462739, -0.010309], [51.463257, -0.010545], [51.463866, -0.010936], [51.464898, -0.011352], [51.464953, -0.011926], [51.465093, -0.012236], [51.465109, -0.012653], [51.465278, -0.013078], [51.465194, -0.013441], [51.46487, -0.013161], [51.545518, -0.007304], [51.545499, -0.003888], [51.543719, -0.003908], [51.543157, -0.003954], [51.543157, -0.003954], [51.542866, -0.004018], [51.54258, -0.004131], [51.542367, -0.004299], [51.541881, -0.00481], [51.541442, -0.005406], [51.541241, -0.005747], [51.54111, -0.005983], [51.540834, -0.006673], [51.540427, -0.007052], [51.540081, -0.007355], [51.539716, -0.007573], [51.539035, -0.007704], [51.538768, -0.007859], [51.538415, -0.00825], [51.53899, -0.009278], [51.539609, -0.008647], [51.539609, -0.008647], [51.540228, -0.008026], [51.540144, -0.0079], [51.539943, -0.007664], [51.539671, -0.007546], [51.539302, -0.007519], [51.538943, -0.007592], [51.538815, -0.007454], [51.538688, -0.007401], [51.538569, -0.007291], [51.537147, -0.005408], [51.537147, -0.005408], [51.536693, -0.004807], [51.536277, -0.004147], [51.535891, -0.004671], [51.535891, -0.004671], [51.533828, -0.007266], [51.533828, -0.007266], [51.531456, -0.010442], [51.530979, -0.010997], [51.530369, -0.012086], [51.530369, -0.012086], [51.529798, -0.013427], [51.529684, -0.013605], [51.529611, -0.013579], [51.529505, -0.013685], [51.52948, -0.014335], [51.528869, -0.015947], [51.528449, -0.017428], [51.528449, -0.017428], [51.528343, -0.017815], [51.528016, -0.020496], [51.528016, -0.020496], [51.527833, -0.021673], [51.526234, -0.020733], [51.525759, -0.020306], [51.525396, -0.020068], [51.525396, -0.020068], [51.524686, -0.019589], [51.523696, -0.018998], [51.523324, -0.018798], [51.522797, -0.018591], [51.522797, -0.018591], [51.522374, -0.018435], [51.522253, -0.01821], [51.522014, -0.018479], [51.521315, -0.018067], [51.521315, -0.018067], [51.51852, -0.01657], [51.518093, -0.0163], [51.517839, -0.01621], [51.516902, -0.016031], [51.516902, -0.016031], [51.516297, -0.015917], [51.516242, -0.015862], [51.515971, -0.015801], [51.515744, -0.015638], [51.515186, -0.015072], [51.514848, -0.014853], [51.514848, -0.014853], [51.514562, -0.014702], [51.511783, -0.013624], [51.511783, -0.013624], [51.511508, -0.013531], [51.511426, -0.013444], [51.51119, -0.013343], [51.511281, -0.011496], [51.511281, -0.011496], [51.511812, -0.005871], [51.511812, -0.005871], [51.512197, -0.003811], [51.512197, -0.003811], [51.512724, -0.000993], [51.512724, -0.000993], [51.512987, 9e-06], [51.514415, 0.002752], [51.515093, 0.005678], [51.515093, 0.005678], [51.5154, 0.007191], [51.515618, 0.007575], [51.515904, 0.007689], [51.515983, 0.007808], [51.516016, 0.007982], [51.515983, 0.008312], [51.515753, 0.008648], [51.515543, 0.008826], [51.515426, 0.008805], [51.515261, 0.008513], [51.515105, 0.007596], [51.514988, 0.007605], [51.514509, 0.008079]]

# Function to divide the coordinates into chunks
def divide_chunks(lst, n):
    # looping till length lst
    for i in range(0, len(lst), n):
        yield lst[i:i + n]

# Split the coordinates into 3 chunks
chunk_size = len(coordinates) // 3
chunks = list(divide_chunks(coordinates, chunk_size))

# Correct the last chunk in case the coordinates don't divide evenly by adding the remaining coordinates to it
if len(coordinates) % 3:
    chunks[-2].extend(chunks[-1])
    chunks.pop()

# Create a map object centered to the average of all the coordinates
m = folium.Map(location=[sum(lat for lat, _ in coordinates) / len(coordinates),
                          sum(lon for _, lon in coordinates) / len(coordinates)],
               zoom_start=17)

# Color list for different polylines
colors = ['blue', 'green', 'red']

# Draw the polylines by connecting the coordinates in each chunk
for idx, chunk in enumerate(chunks):
    folium.PolyLine(chunk, color=colors[idx], weight=2.5, opacity=1).add_to(m)

# Display the map
m
