N00b question regarding /StopPoint/<ID>/Arrivals

Hi there - I have a really basic question that I can’t just get my head around.
I have this example here that works fine :
GET https://api.tfl.gov.uk/StopPoint/940GZZLULYS/Arrivals
I then use this to get the IDs for my local bus tops.
GET https://api.tfl.gov.uk/StopPoint/Search?query=leyton%20green
This gives me IDs of 490G00009133 and 490G00009135
When I put those IDs into Arrivals, I get no data, ie from:
GET https://api.tfl.gov.uk/StopPoint/490G00009135/Arrivals
and
GET https://api.tfl.gov.uk/StopPoint/490G00009133/Arrivals
I am trying to get something into a basic grafana display for my local stop. Frustratingly, it works with a load of other stops but just not mine !

I’ll put this on a public link “soon”.

Hi @RichGreen - welcome!

For buses, the predictions are mapped at a stop point level in NaPTAN, whereas tube, DLR, tram etc are all mapped to the stop area level.

For the Leyton Green stop you’ve listed (490G00009133), there are several children that you can get out of the API:

https://api.tfl.gov.uk/StopPoint/490G00009133

You can see in there the 2 children:

490009133G (Stop SL)
490009133W (Stop NC)

You can then call each of the children to get the predictions list. e.g. https://api.tfl.gov.uk/StopPoint/490009133W/Arrivals

Hope that makes sense.

Many thanks,
James

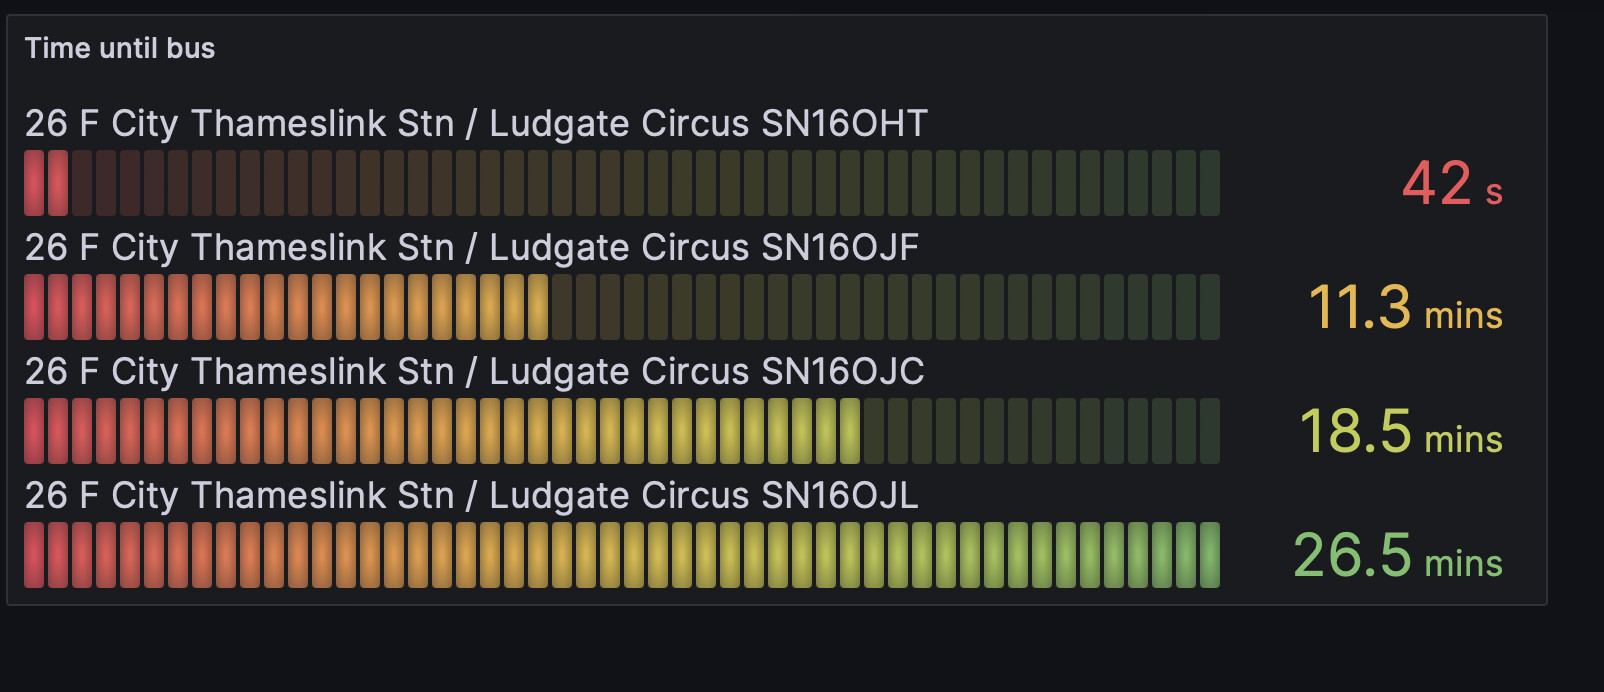
That makes perfect sense. That’s all working great now and I have a TFL → Grafana integration working swimmingly.

If anyone else is interested, this is the json for the dashboard (once you’ve set up the infinity data source and also added a User-Agent to prevent a 403).


{
  "annotations": {
    "list": [
      {
        "builtIn": 1,
        "datasource": {
          "type": "grafana",
          "uid": "-- Grafana --"
        },
        "enable": true,
        "hide": true,
        "iconColor": "rgba(0, 211, 255, 1)",
        "name": "Annotations & Alerts",
        "type": "dashboard"
      }
    ]
  },
  "editable": true,
  "fiscalYearStartMonth": 0,
  "graphTooltip": 0,
  "id": 3,
  "links": [],
  "liveNow": false,
  "panels": [
    {
      "datasource": {
        "type": "yesoreyeram-infinity-datasource",
        "uid": "ff6a69c0-bef5-4f17-b26f-abadd84e7090"
      },
      "fieldConfig": {
        "defaults": {
          "color": {
            "mode": "continuous-RdYlGr"
          },
          "mappings": [],
          "min": 0,
          "thresholds": {
            "mode": "absolute",
            "steps": [
              {
                "color": "green",
                "value": null
              },
              {
                "color": "red",
                "value": 80
              }
            ]
          },
          "unit": "s",
          "unitScale": true
        },
        "overrides": []
      },
      "gridPos": {
        "h": 9,
        "w": 22,
        "x": 0,
        "y": 0
      },
      "id": 1,
      "options": {
        "displayMode": "lcd",
        "maxVizHeight": 300,
        "minVizHeight": 16,
        "minVizWidth": 8,
        "namePlacement": "auto",
        "orientation": "horizontal",
        "reduceOptions": {
          "calcs": [],
          "fields": "/^timeToStation$/",
          "values": true
        },
        "showUnfilled": true,
        "sizing": "auto",
        "valueMode": "color"
      },
      "pluginVersion": "10.3.3",
      "targets": [
        {
          "columns": [],
          "datasource": {
            "type": "yesoreyeram-infinity-datasource",
            "uid": "ff6a69c0-bef5-4f17-b26f-abadd84e7090"
          },
          "filters": [],
          "format": "table",
          "global_query_id": "",
          "parser": "backend",
          "refId": "A",
          "root_selector": "",
          "source": "url",
          "type": "json",
          "url": "https://api.tfl.gov.uk/StopPoint/490009135EJ/Arrivals",
          "url_options": {
            "data": "",
            "headers": [
              {
                "key": "User-Agent",
                "value": "Grafana"
              },
              {
                "key": "header-key",
                "value": "header-value"
              }
            ],
            "method": "GET"
          }
        }
      ],
      "title": "Time until bus",
      "transformations": [
        {
          "id": "filterFieldsByName",
          "options": {
            "include": {
              "names": [
                "lineId",
                "timeToStation",
                "platformName",
                "stationName",
                "vehicleId"
              ]
            }
          }
        },
        {
          "id": "sortBy",
          "options": {
            "fields": {},
            "sort": [
              {
                "field": "timeToStation"
              }
            ]
          }
        }
      ],
      "type": "bargauge"
    }
  ],
  "refresh": "5s",
  "schemaVersion": 39,
  "tags": [],
  "templating": {
    "list": []
  },
  "time": {
    "from": "now-1h",
    "to": "now"
  },
  "timepicker": {},
  "timezone": "",
  "title": "Time till bus",
  "uid": "ec0c1486-03e6-4b64-bc80-11e764466e66",
  "version": 7,
  "weekStart": ""
}
1 Like

Ok -I have a running example here: Grafana
which demonstrates how fast I have to run down the stairs to get the bus I’m after. Thanks once again !

2 Likes