Data drop: near-real-time crowding data API

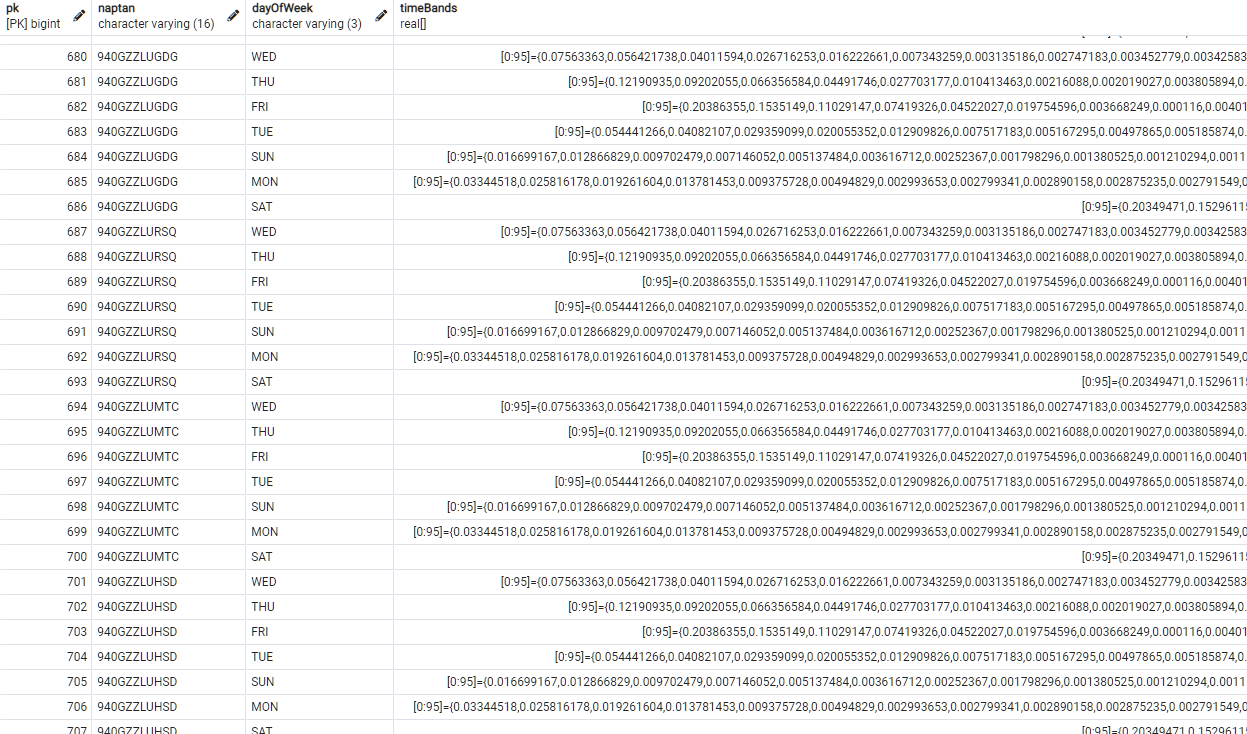
In addition to the historical crowding data we released earlier this year, we’ve now released near-real-time crowding data. This calculates busyness at a station level every 5 minutes, as a fraction of the busiest the station has been since data collection began (July 2019). The data covers all tube stations apart from Kensington Olympia, Heathrow Terminal 5 and Willesden Junction. We also consider Monument the same station as Bank for the purposes of crowding so don’t provide separate data for that.

As before, the data is depersonalised and aggregated to protect the privacy of customers.

The request should look like this:

https://api.tfl.gov.uk/crowding/{Naptan}/Live?app_key={ApplicationKey}

{Naptan} should be replaced with the Naptan code of the desired station, and {ApplicationKey} should be replaced with your Application Key for the Unified API (you will need to register to obtain this). It is only possible to get data for one station per request, multiple stations require multiple requests.

The response should look like this:

{“dataAvailable”:true,“percentageOfBaseline”:0.13020833,“timeUtc”:“2021-07-02T11:46:00.000Z”,“timeLocal”:“2021-07-02 12:46:00”}

“percentageOfBaseline” is the latest crowding value, calculated in the last 5 minutes. This is generally between 0 and 1, but can be over 1 in some circumstances. Levels should be described to users in the following way:

Less than 0.4 = quiet

0.4 to 0.7 = busy

Greater than 0.7 = very busy

How TfL is using this data:

To support our demand management campaigns we are using the data to promote to our customers the quieter times at all London Underground stations to help them plan their journeys. This supports our objective of spreading demand across the day and our network.

As restrictive measures ease, it will be especially important to reassure customers and provide them with information that helps them plan journeys at quieter times and make the most of the network’s capacity.

How we would like you to represent the data:

Please focus on the quieter times at the stations, rather than busy times or the peaks.

We hope that customers will use this information to retime their journeys to quieter times and avoid busy times at their origin, interchange or destination stations.

Having access to quieter times at London Underground stations can enhance customer journeys and help reduce crowding.

If you have any questions about the data, please let me know.

Joe

1 Like

Hey Joe,

Just wondering if you could clarify what the Crowding Day of Week Api does. (The GET endpoint: https://api.tfl.gov.uk/crowding/{Naptan}/{DayOfWeek} )
Is the data returned an average percentageOfBaseLine, per day since July 2019? Or does it return data based on the last week?

Thank you in advance,

Jonathan

@Jonny212 Wecome.

I think the idea is that the data is showing the pattern for the given Naptan where 100% is the busiest and 0% “totally quiet”.

I think is then adjusted to deal with things like events (say, football matches) that the system knows about.

However, it can’t tell you that it’s a quiet weeka.

Thanks for replying so quickly @briantist ,

Thanks for the information about the data being adjusted, that’s very helpful

Let’s say i query the API for a specific day, let’s say Tuesday. Is the response from the API a prediction of what the the next Tuesday’s percentageOfBaseLine is ?

I’m a bit confused as to what the API tells me about a specific day. I would love a definition if that’s possible

(and @jwithers )

I’ve started looking at the data here for Liverpool Street https://api.tfl.gov.uk/crowding/940GZZLULVT?app_key=XXX and it does seem that there is actually:

  • Data predicted for each day of the week
  • The data is divided into 15 minute segments (not the five in the message above)
  • There is only data for Underground station, even when TfL runs services from a mainline station (so there is 940GZZLULVT for Liverpool Street Tube but not for 910GLIVST where TfL Rail runs from).

So quite how to attach this data to use views I’m not sure of. Should it be added to a “departure board” type view

We’ve been showing the Darwin data on Departure boards viz…

but is is OK to add this data from the TfL stations because you would have to add Whole Underground Station data to multiple lines and directions…

@Jonny212

OK, I’ve actually managed to implement this in out app…

Basically, I wrote a console job that scraped all the data from the API and stored it in a nice Postgres table using the naptan and dayOfWeek as index, as well as turning the slot number (ie, divide by 15 minutes) into a key.

It’s Postgres so you can create a real[] array to store these in and not worry too much about anything other than making some indexes…

So it’s just (for example)

SELECT "timeBands"[56] as "percentageOfBaseLine" 	FROM public.tflgovukcrowding
            where naptan ilike '940GZZLUEUS' and "dayOfWeek" ilike 'Wed'

to grab the value to put into the output data.